algorithmic modeling for Rhino
Hola,
In big definitions its at times difficult to find those junctions where the computing is getting heavy. The 'profiler' is great for this, but I would wish for a way to visualize results in a big definition. By the time a big def is created, one should know where these bottlenecks are, but sometimes things change, a portion of the def gets reworked, and it has repercussions downstream.
I could see a few ways to go about it:
1. Implement a 'find' feature much like the current find system which we can use with F3 or Edit > Find. Maybe it would have a way to sort the values based on computation time.
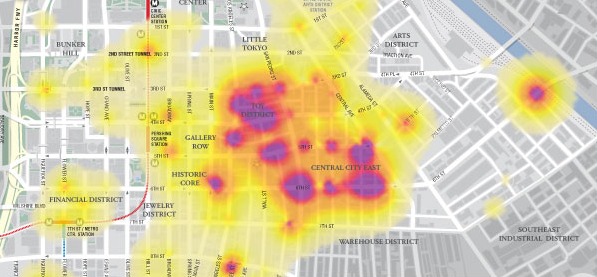
2. A heatmap of sorts which would give us an overall view of the computation time throughout the definition? Perhaps it could take advantage of the grouping tool that already exists in GH?
Is there any current path to developing these sorts of tools by 'third parties?'
Views: 1268
Replies to This Discussion
-
Is there any current path to developing these sorts of tools by 'third parties?'
It is technically possible to add items to the menu in Grasshopper, but it requires quite a lot of hacking as there is no specific pipeline for doing this.
It has occurred to me before that it would be useful to be able to enter some sort of analysis mode that coloured components based on memory consumption or computing cycles (or a dozen other metrics you care to name), but there's at present no way to alter the colour of a component from the outside.
Drawing some sort of heat-map as a background layer would be a good approach as it wouldn't require additional logic to be embedded in every object on the canvas.
A minimalistic approach would be to just allow you to search (using F3) for "bottleneck" and to report the runtimes directly in the search window.
--
David Rutten
david@mcneel.com
Poprad, Slovakia
-
-
Drawing some sort of heat-map as a background layer would be a good approach as it wouldn't require additional logic to be embedded in every object on the canvas.
gets my vote.
-
-
Drawing some sort of heat-map as a background layer would be a good approach as it wouldn't require additional logic to be embedded in every object on the canvas.
A minimalistic approach would be to just allow you to search (using F3) for "bottleneck" and to report the runtimes directly in the search window.
It seems the information is already created by the profiler: the position of the component as well as the time it took to solve. The minimalistic approach would already be very useful. Can I request it as a distraction from your list of things to do for 0.9? ;)
Heatmap would be nice as well, but maybe its too much of a distraction at the moment?
-
-
I think either is too much of a distraction for 0.9.0001. If I get some free time (perhaps during internal testing) I can have a look at it, but don't expect to get this until at least 0.9.0002
--
David Rutten
david@mcneel.com
Poprad, Slovakia
-
-
Drawing some sort of heat-map as a background layer would be a good approach as it wouldn't require additional logic to be embedded in every object on the canvas.
or
A minimalistic approach would be to just allow you to search (using F3) for "bottleneck" and to report the runtimes directly in the search window.
+1 on that :) It would be very helpful.
-
© 2025 Created by Scott Davidson.
Powered by
![]()
